Mastering AP Statistics Chapter 7 with a Practice Test: Boost Your Exam Prep

As statistics play an increasingly important role in various fields such as business, medicine, and social sciences, it is essential for students to have a strong understanding of the subject. To measure and analyze data accurately, a solid foundation in statistical concepts and methodologies is crucial. Chapter 7 of AP Statistics is designed to expand students’ knowledge and skills in inferential statistics.
Through Chapter 7, students will delve into the concept of sampling distributions, which serve as the basis for making informed inferences about population parameters. They will learn about the Central Limit Theorem and how it enables statisticians to estimate population parameters using sample data. Additionally, students will explore the application of sampling distributions in hypothesis testing and constructing confidence intervals.
A crucial component of Chapter 7 is practice. By familiarizing themselves with different types of problems and scenarios, students can gain confidence in their ability to apply statistical concepts and techniques effectively. This practice can come in the form of practice tests that mimic the format and content of the AP Statistics exam. Practice tests allow students to assess their understanding of key concepts, identify areas for improvement, and build test-taking skills.
This article will provide a practice test for Chapter 7 of AP Statistics, allowing students to gauge their knowledge and readiness for the exam. By answering the test questions, students can assess their understanding of sampling distributions, hypothesis testing, confidence intervals, and other crucial topics covered in Chapter 7. The answers and explanations for each question will be provided, giving students the opportunity to reinforce their understanding and rectify any misconceptions.
Key Concepts of AP Statistics Chapter 7 Practice Test
In AP Statistics Chapter 7, students learn about various key concepts related to sampling distributions. The practice test for this chapter covers important topics such as sampling variability, the central limit theorem, and the standard error of the mean.
Sampling variability: One of the key concepts in this chapter is sampling variability, which refers to the fact that different random samples from the same population may yield different sample statistics. Understanding sampling variability is crucial in statistical analysis as it helps to determine the reliability and accuracy of sample estimates.
Central limit theorem: Another important concept covered in the practice test is the central limit theorem. This theorem states that if a sample is drawn from any population with a finite mean and standard deviation, then as the sample size increases, the sampling distribution of the sample mean becomes increasingly close to a normal distribution. The central limit theorem is important in statistical inference as it allows us to make inferences about the population based on the sample data.
Standard error of the mean: The practice test also focuses on understanding the standard error of the mean. This concept quantifies the variability of the sample mean and is calculated as the standard deviation of the sampling distribution of the sample mean. The standard error of the mean is essential in hypothesis testing and constructing confidence intervals.
In addition to these key concepts, the AP Statistics Chapter 7 practice test may also cover topics such as sampling distributions for proportions, the sampling distribution of the difference between two means, and the sampling distribution of the proportion difference between two populations. The test is designed to assess students’ understanding and ability to apply these concepts in various statistical scenarios.
- Sampling variability
- Central limit theorem
- Standard error of the mean
- Sampling distributions for proportions
- Sampling distribution of the difference between two means
- Sampling distribution of the proportion difference between two populations
Understanding the Concepts of Sampling Distributions

A sampling distribution refers to the distribution of a statistic, such as the mean or standard deviation, calculated from multiple samples of the same population. It allows us to understand the variability in the sample statistic and make inferences about the population parameter.
Central Limit Theorem: The central limit theorem states that as the sample size increases, the sampling distribution of the sample mean approaches a normal distribution, regardless of the shape of the population distribution. This allows us to make assumptions about the population mean based on the sample mean.
Standard Error: The standard error is a measure of the variability in the sample statistic. It is the standard deviation of the sampling distribution and represents the average amount that the sample statistic deviates from the population parameter. A smaller standard error indicates less variability and a more precise estimate of the population parameter.
Sampling Distribution of the Sample Mean: For a population with mean μ and standard deviation σ, the sampling distribution of the sample mean follows a normal distribution with mean μ and standard deviation σ/√n, where n is the sample size. This distribution becomes more bell-shaped as the sample size increases.
Sampling Distribution of the Sample Proportion: For a population with proportion p and sample size n, the sampling distribution of the sample proportion follows a normal distribution with mean p and standard deviation √(p(1-p)/n). This distribution becomes more symmetric as the sample size increases.
By understanding the concepts of sampling distributions, we can make more accurate inferences about a population based on sample data. It allows us to determine the likelihood of observing certain sample statistics and helps us assess the precision of our estimates.
Importance of Central Limit Theorem
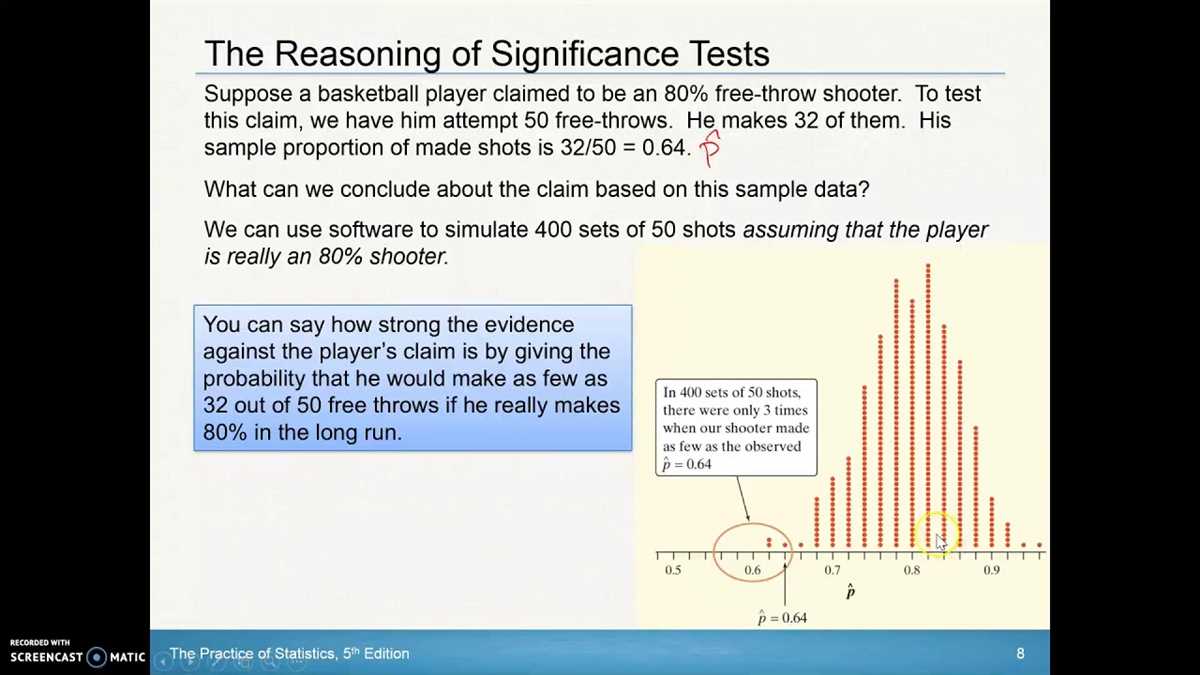
The Central Limit Theorem (CLT) is a fundamental concept in statistics that plays a crucial role in many real-world applications. This theorem states that when independent random variables are added, their sum tends toward a normal distribution, regardless of the shape of the original distribution. This has profound implications for statistical inference and hypothesis testing.
The CLT allows us to make accurate predictions and estimates about a population based on a smaller sample size. By taking a random sample from a population and applying the CLT, we can make inferences about the population mean or proportion with a certain level of confidence. This is particularly useful when it is impractical or impossible to collect data from an entire population.
Furthermore, the CLT is the basis for many statistical techniques and tests, such as the t-test and z-test. These tests rely on the assumption that the sample means or proportions follow a normal distribution, which is ensured by the CLT. Without this important theorem, many statistical analyses would not be possible or reliable.
The CLT also allows us to understand the behavior of averages in a variety of situations, whether it is the heights of individuals, the weights of objects, or the scores of students on a test. It provides a mathematical foundation for understanding variability and can help us identify outliers or unusual observations. By understanding the concept and application of the CLT, statisticians can make more informed decisions and draw more accurate conclusions from their data.
In summary, the Central Limit Theorem is of utmost importance in statistics as it allows us to make inferences about populations, provides the basis for many statistical tests, and helps us understand the behavior of averages. It is a powerful tool that allows statisticians to analyze and interpret data with confidence and reliability.
Confidence Intervals and Hypothesis Testing
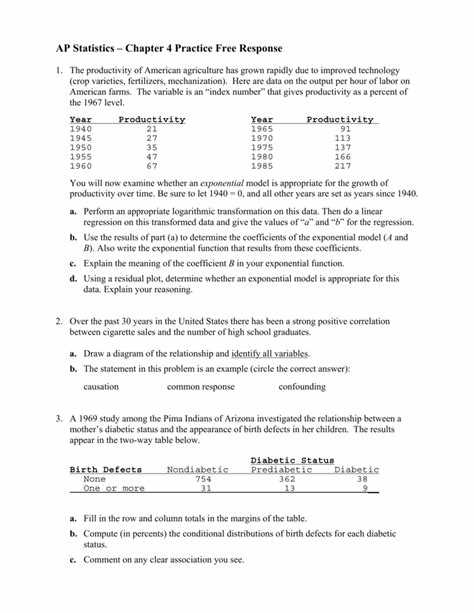
The concept of confidence intervals and hypothesis testing is an integral part of statistics and data analysis. These techniques allow us to make statistical inferences and draw conclusions about a population based on a sample. Confidence intervals provide a range of values within which we can be confident that the true population parameter lies. Hypothesis testing, on the other hand, helps us make decisions about the validity of a claim made about the population.
Confidence intervals are constructed by specifying a desired level of confidence, typically 95%, and using the sample data to estimate the population parameter. The confidence interval is then calculated as the sample statistic plus or minus a margin of error. For example, if we want to estimate the average height of adults in a certain population, we can use a sample to calculate a confidence interval that contains the true population mean height with 95% confidence. This interval conveys the uncertainty in our estimate and provides a range of plausible values for the population parameter.
Hypothesis testing, on the other hand, involves testing a claim or hypothesis about a population parameter. The process typically involves setting up a null hypothesis, which represents the claim we are testing, and an alternative hypothesis, which represents the opposite of the null hypothesis. We then collect and analyze the sample data to determine whether the evidence supports rejecting the null hypothesis in favor of the alternative hypothesis or not. The results of hypothesis testing are typically reported as a p-value, which represents the probability of observing the data or more extreme data if the null hypothesis is true. If the p-value is less than a predetermined significance level, typically 0.05, we reject the null hypothesis in favor of the alternative hypothesis.
In conclusion, confidence intervals and hypothesis testing are powerful tools in statistics for making inferences about population parameters and testing claims about the population. These techniques allow us to quantify uncertainty and draw meaningful conclusions based on sample data. By understanding and applying confidence intervals and hypothesis testing, we can make more informed decisions and draw more accurate conclusions from our data.
Calculating Margin of Error and Sample Size Determination
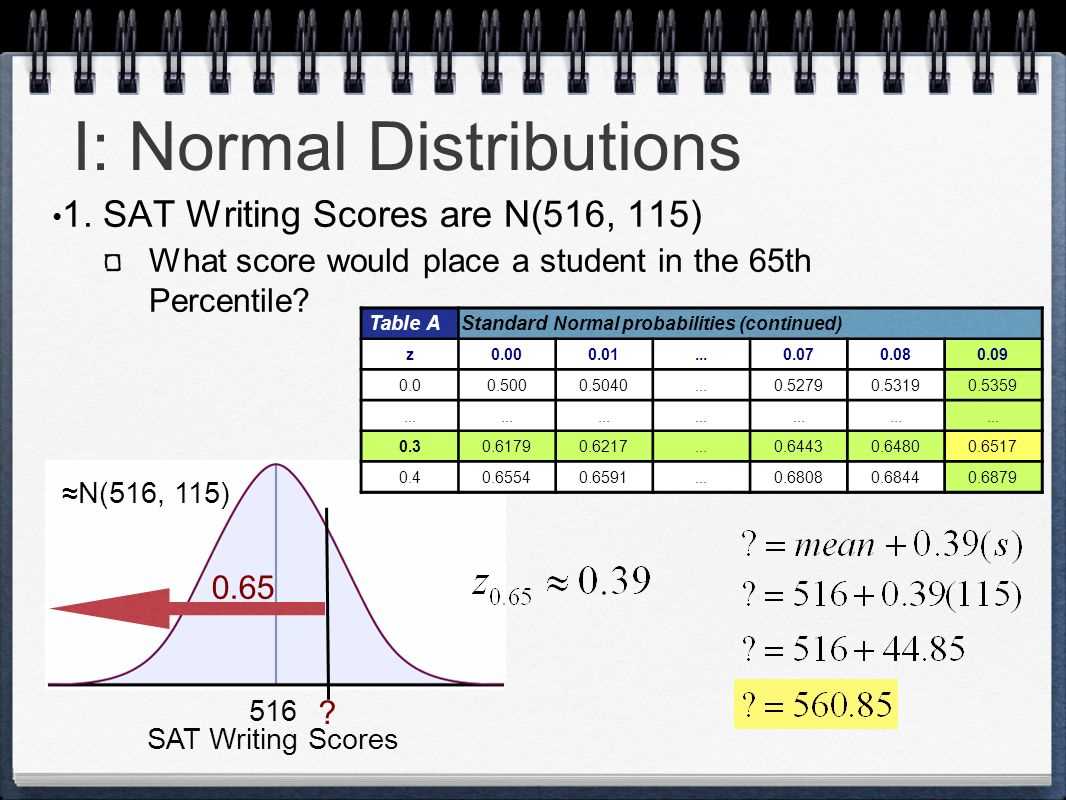
Calculating the margin of error is an important step in statistical analysis. The margin of error is a measurement of the amount of error that can be expected in a sample survey. It takes into account factors such as the sample size and the variability of the data. The margin of error is typically expressed as a percentage, representing the range of values within which the true population parameter is likely to fall.
One way to calculate the margin of error is using the formula:
m = Z * (σ / √n),
where m is the margin of error, Z is the z-score corresponding to the desired level of confidence, σ is the standard deviation of the population, and n is the sample size. This formula allows researchers to determine the sample size needed to achieve a desired level of precision.
Sample size determination plays a crucial role in statistical analysis. It is important to select a sample size that is large enough to provide accurate results, but not so large that it becomes impractical or costly to collect data. The sample size can be determined based on factors such as the desired level of confidence, the margin of error, and the variability of the data.
Various methods can be used to determine the appropriate sample size. One common approach is to use power analysis, which takes into account factors such as the desired level of confidence, effect size, and statistical power. Another approach is to use sample size tables or online calculators, which provide guidelines based on the desired level of confidence and margin of error.
In conclusion, calculating the margin of error and determining the appropriate sample size are important steps in statistical analysis. These calculations help ensure that the results of a survey or study are statistically valid and have a high degree of accuracy. By understanding how to calculate the margin of error and determine sample size, researchers can make informed decisions and obtain reliable data for making inferences about a population.
Practical Application of AP Statistics Chapter 7 Concepts
In AP Statistics Chapter 7, you learned several important concepts related to sampling distributions, including the Central Limit Theorem and the standard error of the mean. These concepts are crucial in understanding how to make inferences about a population based on a sample.
The Central Limit Theorem states that, under certain conditions, the sampling distribution of the mean of a large number of independent and identically distributed random variables will be approximately normally distributed, regardless of the shape of the population distribution. This theorem allows us to estimate population parameters, such as the population mean, using sample data.
One practical application of these concepts is in hypothesis testing. Hypothesis testing allows us to make conclusions about a population based on sample data. By calculating the test statistic and comparing it to a critical value, we can determine whether to reject or fail to reject the null hypothesis.
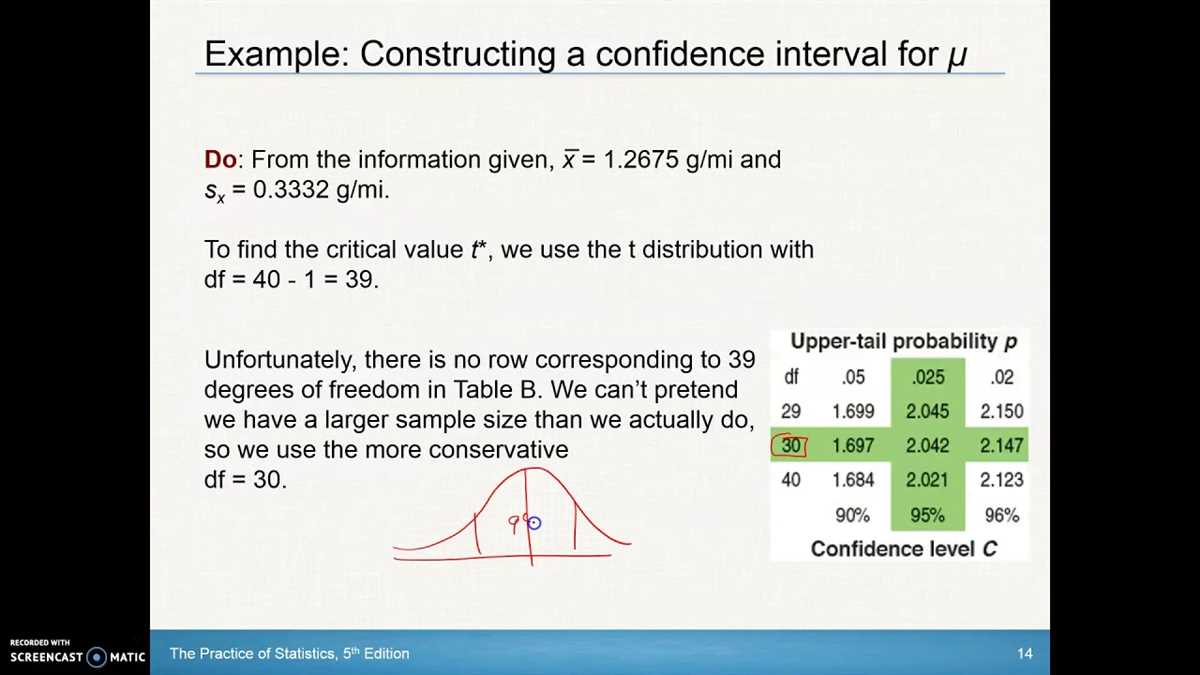
Another practical application is in confidence intervals. A confidence interval provides a range of values within which the true population parameter is likely to fall. By using sample data and the standard error of the mean, we can calculate a confidence interval and estimate the population mean with a certain level of confidence.
Overall, the concepts covered in AP Statistics Chapter 7 are essential for understanding how to make inferences and draw conclusions about a population based on sample data. By understanding the Central Limit Theorem and the standard error of the mean, you can confidently apply these concepts to various statistical analyses and draw meaningful insights from your data.