Break even analysis exam questions and answers
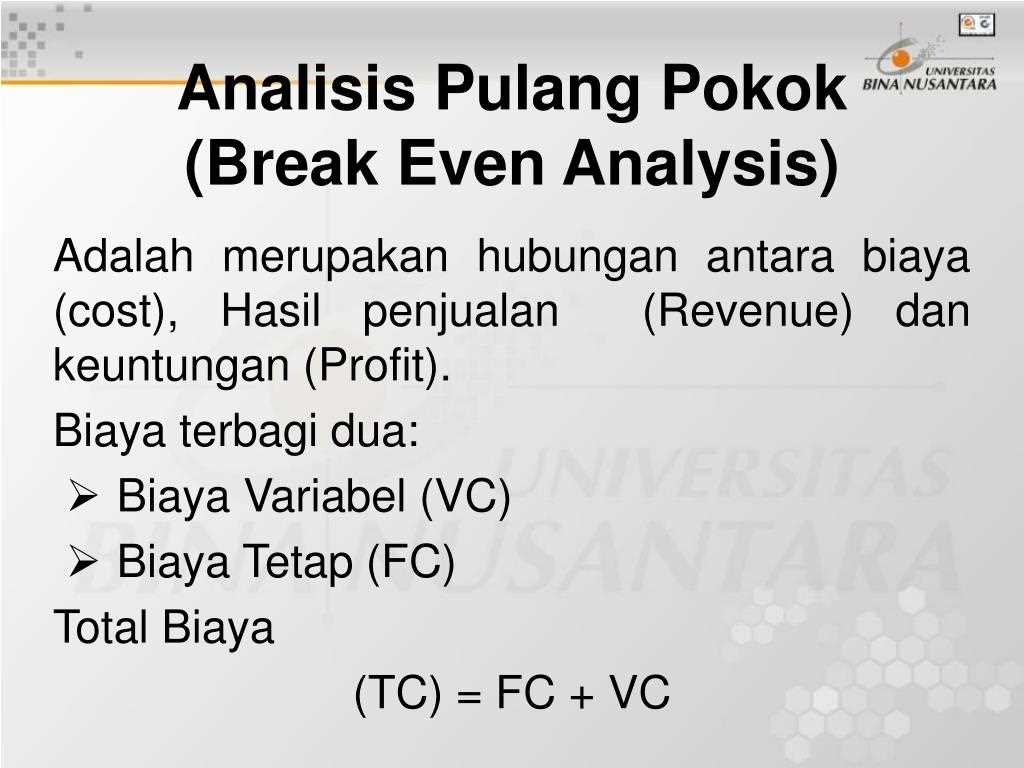
Mastering the concept of determining the point at which costs are matched by revenue is crucial for making informed business decisions. Focus on understanding fixed versus variable expenses. Fixed costs remain constant, regardless of output, while variable costs fluctuate based on production levels. Identify these elements and their role in shaping the financial outlook of a business.
Once you’ve established cost structures, calculate the required output to cover all expenditures. The target is to find the output level where income equals total spending. Recognize that any production above this threshold generates profit, while anything below results in a loss.
When tackling questions on this subject, focus on the formulas and their practical applications. Be ready to calculate the required volume or sales price to break through cost constraints. Practice identifying cost behaviors and how they influence your bottom line under different circumstances. Understanding these dynamics is key to answering questions accurately and efficiently.
Break Even Analysis Exam Questions and Answers
To answer questions related to determining the point where total revenue equals total costs, follow these steps:
1. Understand the Variables: Identify fixed costs (costs that do not change regardless of production) and variable costs (costs that increase as production increases). Fixed costs include rent, salaries, and utilities, while variable costs are materials and labor associated with production.
2. Formula to Remember: Use the formula to calculate the required output:
Required Sales Volume = Fixed Costs / (Selling Price per Unit – Variable Cost per Unit)
3. Common Calculation: In exam questions, you’ll often be asked to find the number of units that need to be sold to cover all costs. For instance, if fixed costs are $10,000, the selling price per unit is $50, and the variable cost per unit is $30, the calculation would be:
| Fixed Costs | Selling Price per Unit | Variable Cost per Unit | Required Sales Volume |
|---|---|---|---|
| $10,000 | $50 | $30 | 500 Units |
4. Answering with Profit or Loss: Be prepared to adjust for changes in prices, variable costs, or fixed costs. If the selling price or variable cost changes, recalculate the required volume. Understand that any values above the break-even volume represent profits, and any below lead to a loss.
5. Example of Variable Adjustments: If the price increases to $60 or variable costs rise to $35, the answer will change accordingly, and the calculation needs to reflect these adjustments for accurate results.
Understanding the Break Even Point Calculation
To determine the point where revenue equals costs, focus on the relationship between fixed and variable expenses, and sales volume. The formula for calculating the threshold is:
- Fixed Costs: These are expenses that remain constant regardless of production levels (e.g., rent, salaries).
- Variable Costs: These costs change directly with production volume (e.g., materials, labor per unit).
- Price per Unit: The amount charged for each item sold.
- Contribution Margin: The difference between the price per unit and variable cost per unit. This is used to cover fixed costs.
Use the following equation to calculate the threshold:
Break Even Point = Fixed Costs / (Price per Unit - Variable Cost per Unit)
This calculation gives the number of units that must be sold to cover all fixed and variable expenses. If the company sells fewer units than the result, it will incur a loss. Selling more than this amount results in profit.
Example

Consider the following data:
- Fixed Costs: $50,000
- Price per Unit: $20
- Variable Cost per Unit: $10
Using the formula:
Break Even Point = 50,000 / (20 - 10) = 50,000 / 10 = 5,000 units
This means the company must sell 5,000 units to cover all costs. Any sales beyond that number contribute to profit.
Knowing this value helps managers make decisions on pricing, cost control, and sales strategies.
How to Analyze Fixed and Variable Costs in Break Even Analysis
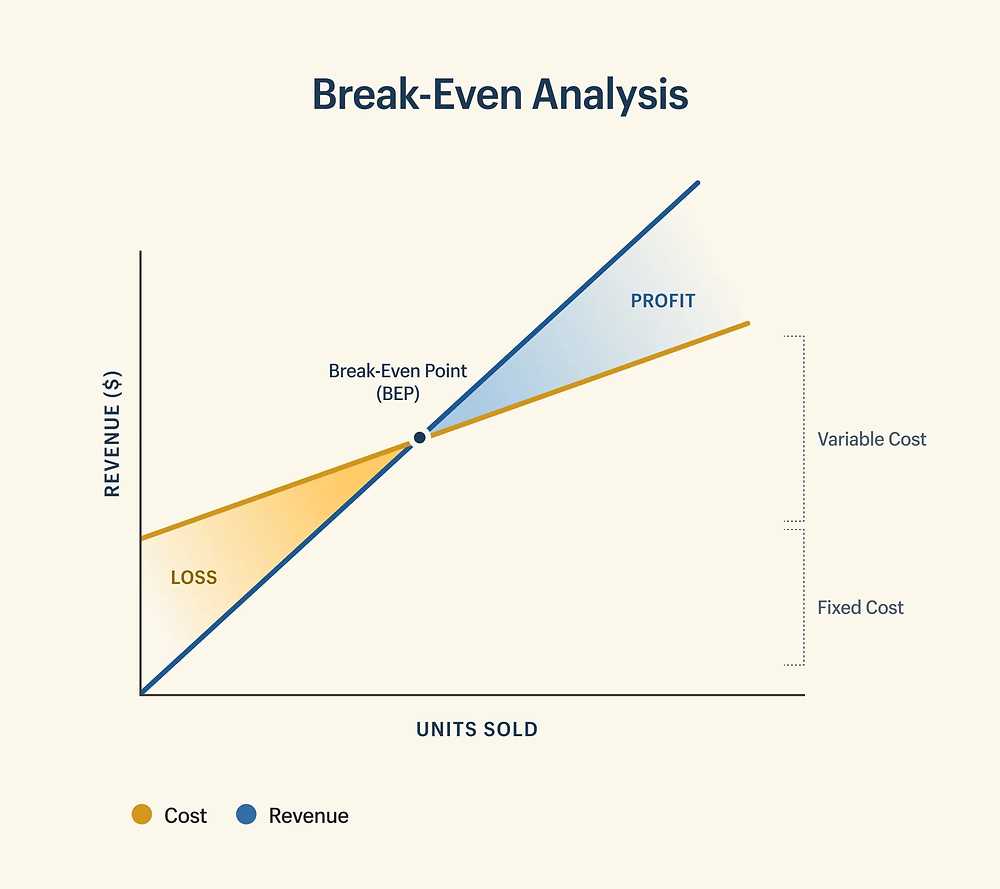
To identify fixed costs, look for expenses that remain constant regardless of the level of production or sales. These include rent, salaries of permanent staff, and equipment depreciation. They do not fluctuate with the number of units produced or sold.
Variable costs, on the other hand, change directly with production levels. These include raw materials, labor hours directly tied to production, and shipping costs. The higher the production volume, the greater the total variable costs.
To calculate total fixed costs, sum all the costs that do not vary with output. For variable costs, track the per-unit cost and multiply by the expected production volume.
Understanding how each type of cost behaves allows you to calculate the minimum sales required to cover all costs. A precise distinction between fixed and variable costs ensures accurate calculations of profit margins and financial viability at different production levels.
Regularly monitor both categories, as changes in fixed costs can be harder to adjust, while variable costs offer more flexibility with changing production output.
Interpreting the Margin of Safety in Break Even Scenarios
The margin of safety (MoS) indicates how much sales can drop before a business starts incurring losses. A higher margin of safety suggests greater financial cushion and stability. To calculate it, subtract the break-even sales level from the actual sales level, then divide by the actual sales. This gives a percentage that reflects the distance between current performance and the point of zero profit.
A margin of safety of 25% means that sales can decline by 25% before the company reaches the point of loss. This figure is critical for understanding risk levels and determining how much flexibility the business has in case of market fluctuations or unforeseen challenges. A larger MoS generally signals lower risk, making it more attractive to investors.
Monitoring MoS over time helps businesses evaluate their financial health. If it narrows, it could indicate declining profitability or increasing vulnerability to changes in the market. Adjusting cost structures, improving sales efforts, or increasing prices could help improve MoS and reduce exposure to loss.
For more information, refer to Investopedia.
Practical Examples of Break Even Calculations in Different Industries

In the retail industry, a clothing store with fixed costs of $30,000 per month and a product price of $50 per unit, with a variable cost of $30 per unit, would need to sell 1,500 units to cover expenses. The calculation would be:
Fixed Costs / (Price per Unit – Variable Cost per Unit) = $30,000 / ($50 – $30) = 1,500 units.
In the food service sector, a small restaurant with fixed monthly expenses of $40,000, selling meals at $25 per dish, with a cost of $10 per dish, would need to serve 2,000 dishes each month to break even:
Fixed Costs / (Price per Meal – Cost per Meal) = $40,000 / ($25 – $10) = 2,000 meals.
For a software company, fixed costs may include salaries, office space, and equipment. If the fixed costs are $200,000 annually, with each software license priced at $500 and a variable cost of $100 per license, the company must sell 400 licenses to cover its expenses:
Fixed Costs / (Price per License – Variable Cost per License) = $200,000 / ($500 – $100) = 400 licenses.
In the manufacturing industry, a company with fixed monthly costs of $75,000, producing widgets at a price of $200 each, with a variable cost of $120 per unit, would need to sell 3,750 units to reach the breakeven point:
Fixed Costs / (Price per Unit – Variable Cost per Unit) = $75,000 / ($200 – $120) = 3,750 units.
For more detailed breakdowns, visit Investopedia.
Common Mistakes to Avoid in Break Even Analysis Calculations

Ignoring fixed costs can lead to significant errors in cost assessments. These expenses are constant and need to be fully accounted for when determining the point where revenue equals costs. Skipping this step can cause misleading results that affect decision-making.
Misclassifying variable costs is another frequent mistake. It’s essential to distinguish between costs that change with production volume and those that don’t. Treating a fixed cost as a variable one, or vice versa, will distort the output.
Incorrect pricing assumptions are common, particularly when projecting revenue. If the unit price changes over time or fluctuates based on market conditions, these shifts need to be reflected in the calculations. Using outdated or unrealistic pricing can lead to inaccurate projections.
Overlooking the sales mix is especially important when dealing with multiple products. If your business offers different products or services with varying margins, not considering the sales mix can lead to a flawed profitability estimate.
Neglecting to update data regularly is another pitfall. Market conditions, cost structures, and other factors can change. Relying on outdated figures can result in an analysis that no longer represents the current financial situation.
Rounding figures too early can also distort the outcome. It’s better to use precise numbers throughout the calculation process and only round the final result. Premature rounding may cause small errors that compound over time.
Confusing contribution margin with profit margin is an easy mistake. The contribution margin measures the difference between sales revenue and variable costs, whereas the profit margin accounts for both fixed and variable costs. Mixing them up can lead to a misunderstanding of the business’s actual performance.
Forgetting to account for taxes can significantly affect the accuracy of the results. Taxes should be considered in the final calculations, as they can reduce the available profit and change the actual point where costs and income align.
How to Use Break Even Analysis to Assess Business Profitability
Identify your fixed costs first. These include rent, salaries, utilities, and insurance. These costs do not change with the level of output, making them predictable. Next, calculate your variable costs, which fluctuate with production. This includes materials, labor, and shipping costs. After calculating both, determine the contribution margin per unit, which is the selling price per unit minus the variable cost per unit.
Once you have the contribution margin, divide your total fixed costs by this figure to determine the number of units needed to cover all expenses. This gives you the sales volume at which the business neither makes a profit nor incurs a loss. Anything above this volume contributes to profit.
Use this information to set sales targets. If your business is not reaching the break-even point, consider adjusting pricing, reducing costs, or finding ways to increase sales volume. Track performance regularly to ensure adjustments are made proactively to stay on course toward profitability.
By consistently evaluating these numbers, you can gauge whether your business is operating efficiently or if financial strategies need to be altered for better performance.