Calculate Kruskal-Wallis H Test for Group Comparison
Statistical analysis is a fundamental component in many research fields, as it enables researchers to draw meaningful conclusions from their data. One statistical test that is commonly used in non-parametric analysis is the Kruskal Wallis H test. This test allows researchers to determine if there are significant differences between three or more independent groups.
The Kruskal Wallis H test is based on ranking the data rather than assuming a normal distribution, making it a powerful tool in situations where the data does not meet the assumptions of a parametric test. It is particularly useful when analyzing data that is measured on an ordinal or interval scale, as it does not require the data to be normally distributed.
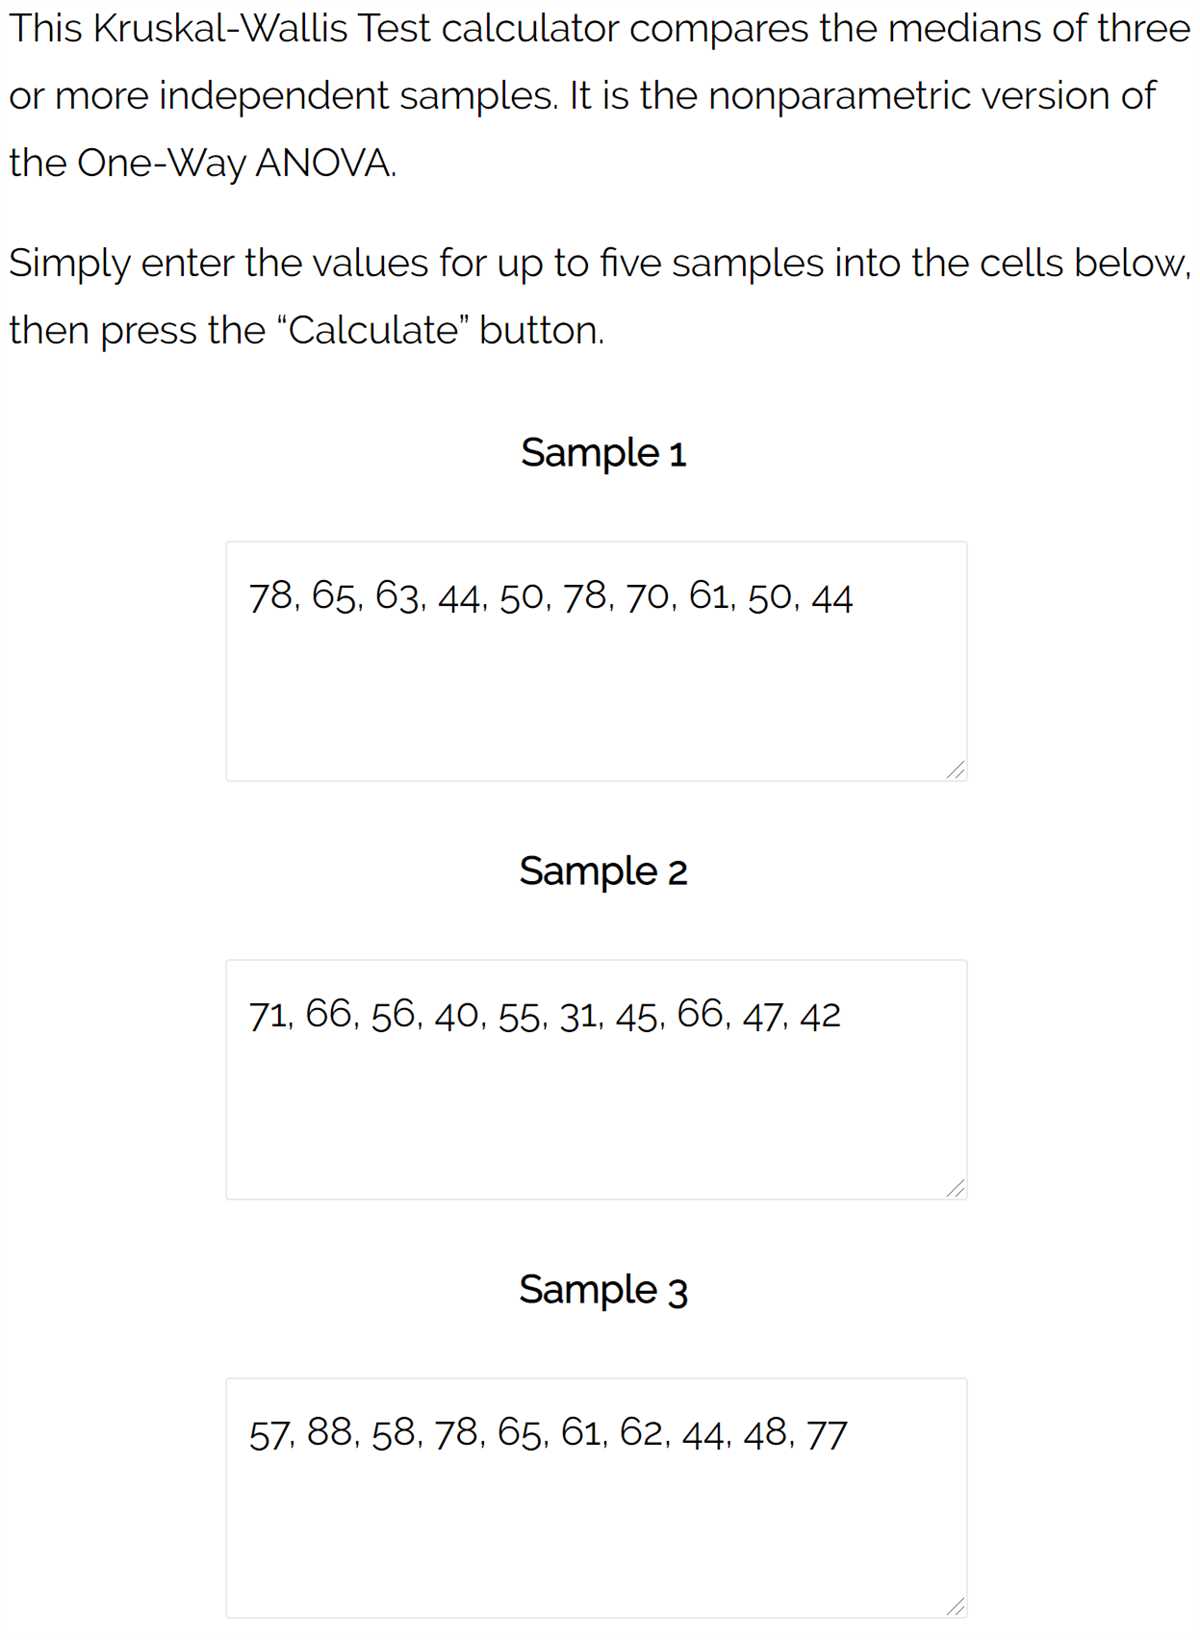
Using a Kruskal Wallis H test calculator can greatly simplify the process of conducting this statistical analysis. The calculator takes in the data from the independent groups and automatically performs the necessary calculations to determine the test statistic and p-value. This saves researchers valuable time and allows them to focus on interpreting the results rather than getting caught up in the intricacies of the calculations.
In addition, a Kruskal Wallis H test calculator can provide researchers with additional information such as the mean ranks for each group and the critical values for different significance levels. This can aid in the interpretation of the results and help researchers make informed decisions based on the statistical analysis.
In conclusion, a Kruskal Wallis H test calculator is a valuable tool for researchers conducting non-parametric analysis. It simplifies the process of performing the statistical test and provides additional information to aid in the interpretation of the results. By utilizing this calculator, researchers can make more efficient use of their time and obtain meaningful insights from their data.
Kruskal Wallis H Test Calculator
The Kruskal Wallis H Test is a non-parametric test used to determine if there are any significant differences between two or more independent groups. It is used when the assumption of normality is violated or when the data is in the form of rankings or ordinal variables. The test compares the medians of the groups to determine if there is a statistically significant difference between them.
To perform the Kruskal Wallis H Test, you can use an online calculator. This calculator allows you to enter the data for each group and automatically calculates the test statistic and p-value. The test statistic, H, follows a chi-square distribution with k-1 degrees of freedom, where k is the number of groups being compared. The p-value is then used to determine if there is a significant difference between the groups.
Using the Kruskal Wallis H Test calculator is relatively straightforward. First, you need to gather your data for each group and organize it into separate columns. Then, you input the data into the calculator, specifying the number of groups and the number of data points in each group. The calculator will then compute the test statistic and p-value for you, allowing you to interpret the results.
Interpreting the results of the Kruskal Wallis H Test involves comparing the p-value to a predetermined significance level, typically 0.05. If the p-value is less than the significance level, it is concluded that there is a significant difference between at least two of the groups. However, if the p-value is greater than the significance level, there is not enough evidence to conclude that there are any significant differences between the groups.
What is the Kruskal Wallis H Test?

The Kruskal Wallis H Test is a non-parametric statistical test that is used to determine if there are any differences between three or more groups based on a single continuous outcome variable. It is an extension of the Mann-Whitney U test, which is used to compare two groups.
In the Kruskal Wallis H Test, data is ranked from lowest to highest across all groups, and the ranks are compared to see if there are any differences among the groups. The test looks at the differences in ranks rather than the raw data, making it suitable for non-normal data or data that violates assumptions of homogeneity of variance.
The null hypothesis of the Kruskal Wallis H Test is that there is no difference in the medians of the groups being compared. If the p-value of the test is less than a chosen significance level (usually 0.05), then the null hypothesis is rejected, indicating that there are significant differences between the groups.
The Kruskal Wallis H Test is often used in situations where the dependent variable is not normally distributed or where the data cannot meet the assumptions of parametric tests like Analysis of Variance (ANOVA). It is widely used in research and can be conducted in various statistical software programs or online calculators.
How does the Kruskal Wallis H Test work?
The Kruskal Wallis H Test is a non-parametric statistical test used to compare three or more independent groups when the dependent variable is ordinal or continuous. This test is an extension of the Mann-Whitney U test, which is used to compare two independent groups.
The Kruskal Wallis H Test works by ranking the data from all the groups together, then calculating the sum of the ranks for each group. The test statistic, H, is calculated by taking into account the differences between the observed ranks and the expected ranks under the null hypothesis of no difference between the groups. The larger the value of H, the more evidence there is against the null hypothesis.
To perform the Kruskal Wallis H Test, the following steps are typically followed:
- Formulate the null hypothesis, which states that there is no difference between the groups.
- Rank the data from all the groups combined.
- Calculate the sum of the ranks for each group.
- Calculate the test statistic, H, using the formula:
$$H = frac{12}{N(N+1)} sum frac{R_i^2}{n_i} – 3(N+1)$$
where N is the total number of observations, ni is the number of observations in each group, and Ri is the sum of the ranks for each group.
The test statistic, H, follows a chi-squared distribution with degrees of freedom equal to the number of groups minus one. If the calculated test statistic is greater than the critical value from the chi-squared distribution, the null hypothesis can be rejected, indicating that there is a significant difference between the groups.
When to use the Kruskal Wallis H Test?
The Kruskal Wallis H test is a non-parametric statistical test used to compare the medians of three or more independent groups. It is used when the data do not meet the assumptions of normality and equal variance required for parametric tests, such as the one-way ANOVA. Instead, the Kruskal Wallis H test assesses whether there are any differences in the medians of the groups based on the ranks of the data.
This test can be used in various research and experimental settings. For example, it can be used in medical research to compare the effectiveness of different treatments on patient outcomes. It can also be used in social sciences to compare the distribution of income across different demographic groups or to analyze the impact of different teaching methods on student performance.
- If the data are not normally distributed
- If the data have unequal variances
- If the data are measured on an ordinal scale or have an arbitrary zero point
- If there are three or more independent groups being compared
Overall, the Kruskal Wallis H test is a valuable statistical tool when analyzing non-normally distributed data and can provide useful insights into the differences between multiple groups. It allows researchers to make inferences about the population based on the ranks of the data, rather than the actual numerical values, making it a versatile option in various fields of research.
Step-by-step guide on performing the Kruskal Wallis H Test
The Kruskal Wallis H Test is a non-parametric statistical test used to compare the medians of two or more independent samples. It is an extension of the Mann-Whitney U test for comparing two samples, but it can handle multiple samples simultaneously.
Here is a step-by-step guide on how to perform the Kruskal Wallis H Test:
- State the null hypothesis and alternative hypothesis: The null hypothesis states that there is no difference in the population medians across all groups, while the alternative hypothesis states that at least one group differs from the others in population median.
- Collect and organize the data: Obtain the data for each group you want to compare. Ensure that the data is in numerical format. Organize the data into individual groups.
- Rank the data: Combine all the data points from all groups and rank them from smallest to largest, ignoring the group membership.
- Calculate the sum of ranks for each group: Sum up the ranks for each group to get the sum of ranks for each group.
- Calculate the Kruskal Wallis H statistic: Use the formula H = (12 / (N(N+1))) * (Σ(Ri^2 / ni) – ((N(N+1)^2) / 4)), where N is the total number of observations, Ri is the sum of ranks for each group, and ni is the number of observations in each group.
- Calculate the degrees of freedom: The degrees of freedom for the Kruskal Wallis H test is equal to the number of groups minus one.
- Find the critical value: Use a chi-square distribution table to find the critical value for the given significance level and degrees of freedom.
- Compare the calculated H statistic with the critical value: If the calculated H statistic is greater than the critical value, reject the null hypothesis. Otherwise, fail to reject the null hypothesis.
By following these steps, you can analyze your data using the Kruskal Wallis H Test and determine if there are significant differences in population medians across multiple groups.
Interpretation of Kruskal Wallis H Test results
The Kruskal Wallis H Test is a non-parametric test used to determine if there are significant differences between three or more independent groups. The test is based on the ranks of the data, rather than the raw data values, making it a suitable option when the data does not meet the assumptions of normality or when the data is ordinal.
After performing the Kruskal Wallis H Test, you will obtain a test statistic (H value) and a p-value. The H value indicates the degree of difference between the groups, while the p-value measures the level of evidence against the null hypothesis of no difference between the groups.
If the p-value is less than the chosen significance level (typically 0.05), it can be concluded that there are significant differences between at least some of the groups. In this case, further post-hoc tests, such as Dunn’s test or pairwise comparisons, can be conducted to determine the specific differences between the groups.
On the other hand, if the p-value is greater than the significance level, there is no evidence to reject the null hypothesis, and it can be concluded that there are no significant differences between the groups.
Limitations of the Kruskal Wallis H Test

The Kruskal Wallis H test is a non-parametric test used to compare the medians of two or more independent groups. While this test is widely used and has its advantages, it also has several limitations that should be considered when interpreting the results.
1. Assumption of Independent Samples: The Kruskal Wallis H test assumes that the samples being compared are independent of each other. If the samples are not truly independent, such as in a repeated measures design, the test may not provide accurate results.
2. Sensitivity to Outliers: The Kruskal Wallis H test is sensitive to outliers in the data. A few extreme values can strongly influence the results of the test, leading to potentially misleading conclusions. It is important to identify and handle outliers appropriately before conducting the test.
3. Equal Variance Assumption: The Kruskal Wallis H test assumes that the groups being compared have the same variance. Violation of this assumption can affect the validity of the test results. If the groups have unequal variances, alternative methods such as the Welch’s ANOVA may be more appropriate.
4. Sample Size: The Kruskal Wallis H test is less powerful than parametric tests such as the analysis of variance (ANOVA), especially with small sample sizes. With small sample sizes, the test may have a higher probability of failing to detect true differences between groups.
5. Post-hoc Comparisons: The Kruskal Wallis H test only determines if there are differences between groups, but does not provide specific information about which groups differ from each other. Post-hoc tests are often needed to determine the specific pairwise differences. However, these post-hoc tests may increase the risk of type I errors.
Despite its limitations, the Kruskal Wallis H test remains a useful tool for analyzing data that does not meet the assumptions of parametric tests. It is important to carefully consider these limitations and interpret the results with caution, taking into account the specific characteristics of the data and study design.