Mastering the Toughest Statistics Final Exam Questions: Answers provided!

Preparing for a statistics final exam can be a daunting task, but with the right set of questions and answers, you can boost your confidence and excel in the subject. This article provides a compilation of frequently asked questions from previous statistics exams, along with their corresponding answers.
Statistics is used in various fields, from research and business to medicine and social sciences. Therefore, it is crucial for students to have a solid understanding of statistical concepts and their application. By familiarizing yourself with the types of questions that may appear on a final exam, you can identify areas that require further study and practice.
The questions in this article cover different topics in statistics, such as probability, hypothesis testing, regression analysis, and sampling methods. Each question is followed by a detailed explanation of the correct answer, allowing you to grasp the underlying principles and reasoning behind it. By going through these questions and answers, you can reinforce your knowledge and improve your problem-solving skills.
Basic statistical concepts
Statistics is a branch of mathematics that deals with the collection, analysis, interpretation, presentation, and organization of data. It provides a way to understand and make sense of the information we encounter in our everyday lives. There are several basic statistical concepts that are fundamental to understanding and applying statistical methods.
Population and sample: In statistics, a population refers to the entire group of individuals or objects that we are interested in studying. A sample, on the other hand, is a subset of the population that is selected for study. It is often not practical or feasible to collect data from an entire population, so samples are used instead.
Descriptive statistics: Descriptive statistics is the branch of statistics that involves summarizing and describing the main features of a dataset. It includes measures such as the mean, median, and mode, which provide information about the central tendency of the data, as well as measures of dispersion, such as the range and standard deviation, which describe the spread of the data.
Inferential statistics: Inferential statistics involves making predictions or inferences about a population based on information obtained from a sample. It allows us to draw conclusions and make generalizations about a larger population based on a smaller, representative sample. Inferential statistics is used to test hypotheses, estimate parameters, and make predictions.
Hypothesis testing: Hypothesis testing is a statistical method used to make decisions about a population based on sample data. It involves stating a null hypothesis, which represents the status quo or the absence of an effect, and an alternative hypothesis, which represents the possibility of an effect. By analyzing the sample data, we can determine whether there is enough evidence to reject the null hypothesis in favor of the alternative hypothesis.
Confidence intervals: Confidence intervals provide a range of values within which a population parameter is likely to fall. They are used to estimate the accuracy and precision of sample statistics. A confidence level, typically expressed as a percentage, represents the probability that the interval will contain the true population parameter. For example, a 95% confidence interval means that in 95 out of 100 samples, the interval will contain the true population parameter.
Statistical tests: There are various statistical tests that are used to analyze data and test hypotheses. These include t-tests, chi-square tests, analysis of variance (ANOVA), regression analysis, and many more. The choice of test depends on the type of data being analyzed and the research question being addressed.
By understanding and applying these basic statistical concepts, we can make informed decisions, draw meaningful conclusions from data, and contribute to the field of statistics.
Descriptive Statistics
In the field of statistics, descriptive statistics refers to the analysis and summarization of data. It provides a way to describe and understand the main features of a dataset without making any inferences or drawing conclusions about a larger population. Descriptive statistics focuses on organizing, presenting, and analyzing data to provide a clear and concise summary of its characteristics.
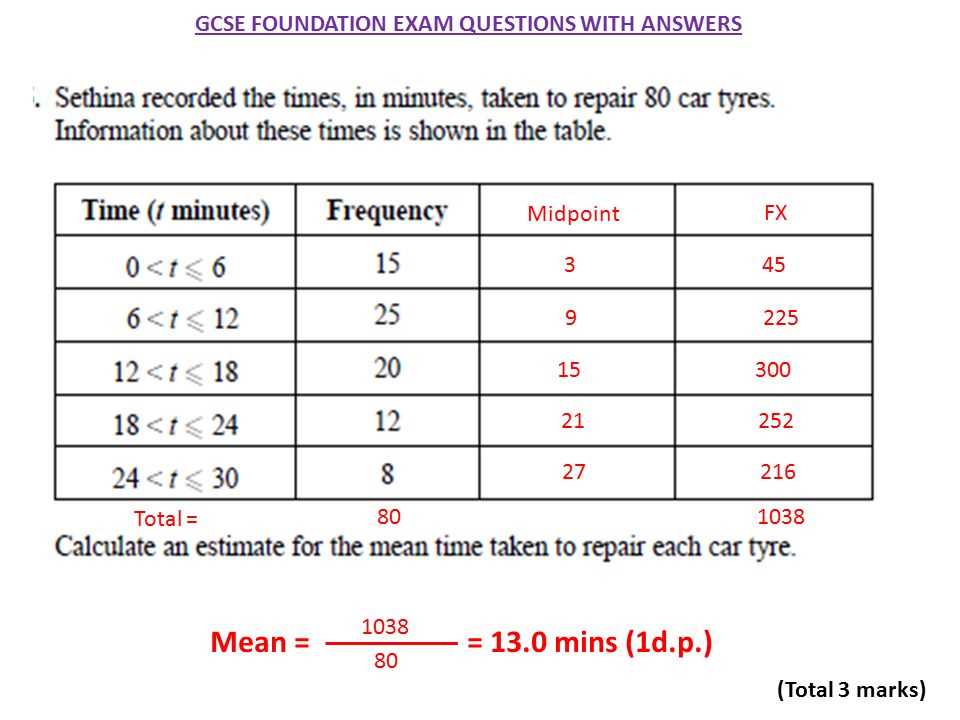
Measures of central tendency are used in descriptive statistics to identify the typical or average value in a dataset. They include the mean, median, and mode. The mean is calculated by summing all the values in a dataset and dividing by the total number of values. The median represents the middle value in a sorted dataset. The mode is the most frequently occurring value. These measures provide a way to understand the central value around which the data is distributed.
Measures of dispersion provide information about the spread or variability of the data. The range is the difference between the maximum and minimum values in a dataset. The standard deviation measures how much the values in a dataset deviate from the mean. A smaller standard deviation indicates less variability, while a larger standard deviation indicates more variability. These measures help to understand the spread of the data and how the values are distributed around the central tendency.
Descriptive statistics also includes graphical methods to visually represent the data. Histograms, bar charts, and pie charts are commonly used to display the distribution of categorical data. Line graphs and scatter plots are used to visualize the relationship between two continuous variables. These graphical representations provide a quick and intuitive way to understand and interpret the data.
Probability Theory
Probability theory is a branch of mathematics that deals with the study of random phenomena and the likelihood of events occurring. It provides a framework for understanding uncertainty and making predictions based on the analysis of data. In probability theory, events are assigned probabilities, which are numerical values representing the likelihood of an event occurring. These probabilities range from 0 to 1, with a probability of 0 indicating that the event is impossible and a probability of 1 indicating that the event is certain to happen. The sum of the probabilities of all possible events in a sample space is always equal to 1.
One of the fundamental concepts in probability theory is the concept of independent events. Two events are considered independent if the occurrence of one event does not affect the probability of the other event. For example, if you toss a fair coin twice, the outcome of the first toss does not affect the outcome of the second toss. In this case, the probability of getting heads on the first toss and tails on the second toss is simply the product of the probabilities of getting heads on the first toss (0.5) and tails on the second toss (0.5), which is 0.25.
Probability theory also includes concepts such as conditional probability, which is the probability of an event occurring given that another event has already occurred, and the law of large numbers, which states that the average of a large number of independent and identically distributed random variables tends to the expected value as the number of trials increases. These concepts and principles are essential in various fields such as statistics, economics, psychology, and engineering, where probability is used to model and analyze uncertain situations and make informed decisions.
In conclusion, probability theory is a fundamental branch of mathematics that provides a framework for understanding and quantifying uncertainty. It allows us to analyze and make predictions based on the probability of events occurring. With its various concepts and principles, probability theory plays a crucial role in many areas of study and has practical applications in numerous fields.
Hypothesis testing
In statistics, hypothesis testing is a method used to make decisions or draw conclusions about a population based on sample data. It involves formulating a hypothesis about the population parameter, collecting sample data, and using statistical techniques to determine whether the observed data supports or contradicts the hypothesis. Hypothesis testing is an essential tool in statistical analysis and helps researchers to make informed decisions and draw valid conclusions.
The process of hypothesis testing involves several steps. First, the researcher formulates a null hypothesis (H0) and an alternative hypothesis (Ha). The null hypothesis represents the status quo or the assumption that there is no significant difference or effect in the population. The alternative hypothesis, on the other hand, suggests that there is a significant difference or effect in the population. The next step is to collect sample data and calculate a test statistic, which measures the level of agreement or disagreement between the data and the null hypothesis.
Once the test statistic is calculated, it is compared to a critical value (also known as the p-value) determined based on the significance level selected by the researcher. If the test statistic falls within the rejection region (i.e., it is less than the critical value), the null hypothesis is rejected, and the alternative hypothesis is accepted. If the test statistic falls outside the rejection region, the null hypothesis is not rejected, and no significant difference or effect is found in the population. The results of hypothesis testing are typically presented in terms of a p-value, which represents the probability of obtaining the observed data under the assumption that the null hypothesis is true.
Hypothesis testing is widely used in various fields such as medicine, psychology, economics, and social sciences to make informed decisions based on empirical evidence. It allows researchers to evaluate the effectiveness of interventions, compare groups, assess the impact of variables, and explore relationships between variables. By applying rigorous statistical techniques, hypothesis testing provides a framework for drawing meaningful conclusions from data and advancing scientific knowledge.
Regression Analysis
Regression analysis is a statistical method used to estimate and understand the relationship between two or more variables. It is commonly used in various fields, including economics, finance, social sciences, and marketing. The goal of regression analysis is to find the best-fitting line or curve that represents the relationship between the dependent variable and one or more independent variables.
In regression analysis, the dependent variable is the variable being predicted or explained, while the independent variables are the factors that potentially influence the dependent variable. The regression equation is used to calculate the value of the dependent variable based on the values of the independent variables. The key concept in regression analysis is that the relationship between the dependent variable and the independent variables can be expressed mathematically and can be used to make predictions or draw conclusions.
There are different types of regression analysis, including simple linear regression, multiple linear regression, logistic regression, and polynomial regression. Simple linear regression involves only one independent variable, while multiple linear regression involves two or more independent variables. Logistic regression is used when the dependent variable is categorical, and polynomial regression is used when the relationship between the variables is nonlinear.
Regression analysis also allows for the assessment of the statistical significance of the relationship between the variables. This is done by testing the null hypothesis that the coefficients in the regression equation are equal to zero. If the p-value associated with the coefficient is less than a predetermined significance level (commonly 0.05), the relationship between the variables is considered statistically significant.
In conclusion, regression analysis is a powerful tool for understanding and predicting relationships between variables. It provides a quantitative method to analyze data and make informed decisions based on the results. By using regression analysis, researchers and practitioners can gain valuable insights into the factors that influence a particular outcome and make accurate predictions about future trends.
Data Interpretation and Analysis

Data interpretation and analysis play a crucial role in the field of statistics. By collecting, organizing, and analyzing data, statisticians are able to draw meaningful conclusions and make informed decisions. Through various statistical techniques, they can reveal patterns, trends, and relationships within the data, providing valuable insights for businesses, researchers, and policymakers.
Interpretation of data involves making sense of the numerical values and patterns that emerge from the data analysis process. It requires statisticians to use their expertise to explain the significance of findings and how they relate to the research question or problem at hand. This step is essential in translating raw data into actionable knowledge.
Analysis of data involves applying statistical methods and techniques to explore, summarize, and interpret the data. Statisticians use various tools, such as descriptive statistics, hypothesis testing, regression analysis, and data visualization, to gain a deeper understanding of the data and draw meaningful conclusions. They also ensure the validity and reliability of the analysis by considering potential biases and limitations.
Overall, data interpretation and analysis are valuable skills for anyone working with data. They provide a systematic and objective approach to understanding complex information and can help drive evidence-based decision making. By uncovering patterns and trends, data analysis allows us to recognize opportunities, identify potential risks, and make informed choices. Whether it’s in business, research, healthcare, or public policy, the ability to interpret and analyze data is crucial for success in a data-driven world.