Unlocking the Truth: Evaluating Claims with a Custom Confidence Interval
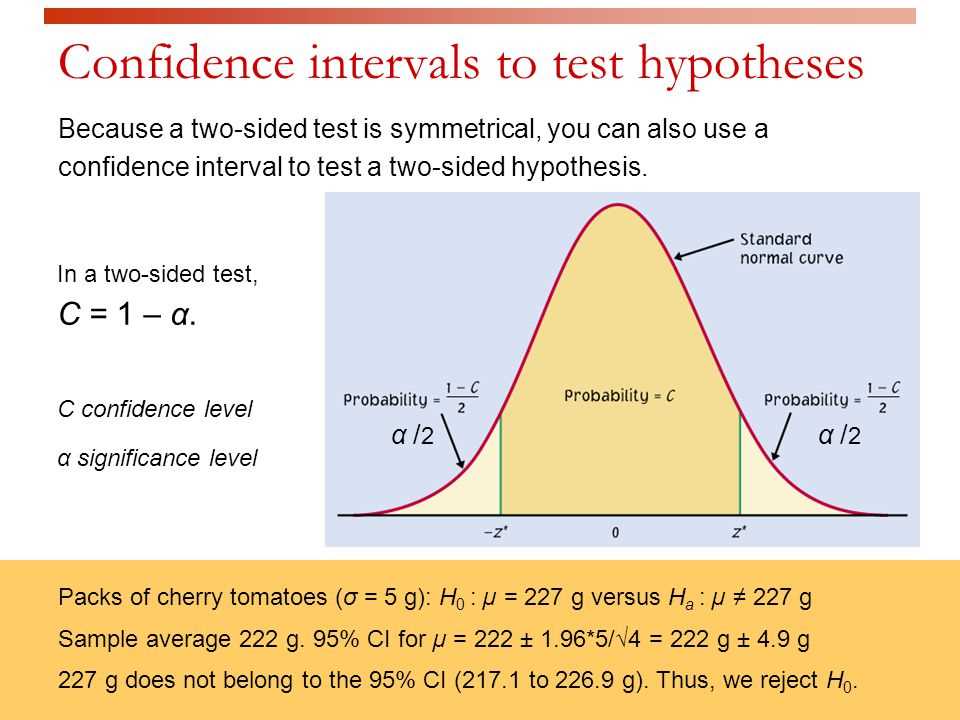
In statistics, confidence intervals not only provide estimates for population parameters, but also serve as a tool for hypothesis testing. They allow us to test claims made about a population based on a sample. By constructing an appropriate confidence interval, we can determine whether a claim is plausible or if it should be rejected.
To test a claim using a confidence interval, we need to gather a sample from the population and calculate the sample mean and standard deviation. These values form the basis for constructing the interval. The confidence level, often denoted as (1-α), determines the width of the interval.
The process of constructing a confidence interval involves determining the margin of error, which represents the range within which the population parameter is likely to lie. The margin of error depends on the sample size and the standard deviation or standard error of the sampling distribution. By calculating the margin of error and adding/subtracting it from the sample mean, we obtain the confidence interval.
Once the confidence interval is constructed, we can compare it to the claim made about the population parameter. If the claim falls within the confidence interval, it is considered plausible. However, if the claim is outside the interval, it suggests that the claim may not be true for the population as a whole. Therefore, by testing the claim through the construction of an appropriate confidence interval, we can make informed decisions based on the data available.
What is a confidence interval and why is it important?
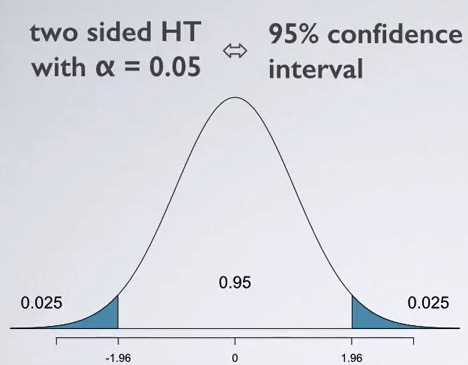
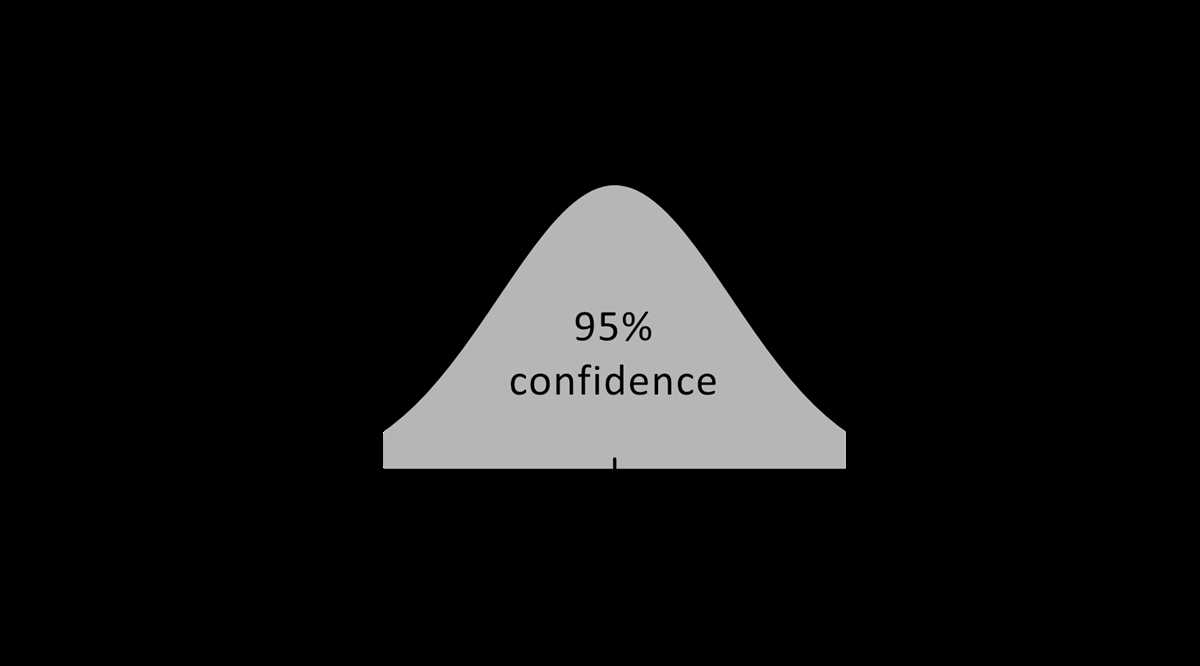
A confidence interval is a range of values that we can be reasonably sure contains the true value of a parameter of interest. It is an estimated range for an unknown population parameter based on a given sample. Confidence intervals are commonly used in statistical inference to quantify the uncertainty associated with parameter estimation. They provide a range of plausible values for the parameter and allow us to make conclusions or decisions based on the observed data.
Confidence intervals are important because they provide us with an indication of the precision and reliability of our estimate. Rather than giving a single point estimate, which may be subject to sampling variability, confidence intervals provide a range of values within which the true parameter value is likely to fall. This allows us to assess the potential variability in our estimate and understand the level of uncertainty. A wider confidence interval indicates a larger degree of uncertainty, while a narrower confidence interval indicates a higher level of precision.
Additionally, confidence intervals allow us to test claims or hypotheses about population parameters. By constructing a confidence interval, we can determine if a claim falls within the range of plausible values. If the claim lies within the confidence interval, we may accept it as plausible. If the claim falls outside the confidence interval, we may reject it as unlikely. In this way, confidence intervals play a crucial role in hypothesis testing and decision-making.
Step 1: Define the problem and formulate the hypothesis
When conducting a statistical analysis, the first step is to define the problem and formulate the hypothesis. This involves clearly stating the research question or problem that needs to be addressed, as well as developing a hypothesis that can be tested.
In the case of testing a claim by constructing a confidence interval, the problem may involve determining whether a certain parameter, such as the mean or proportion, falls within a specific range. For example, an economist might be interested in determining if the average salary in a particular industry is significantly different from a stated value.
To formulate the hypothesis, it is important to clearly state the null and alternative hypotheses. The null hypothesis assumes that there is no significant difference or effect, while the alternative hypothesis suggests that there is a significant difference or effect. In the example mentioned earlier, the null hypothesis would state that the average salary is equal to the stated value, while the alternative hypothesis would state that the average salary is different from the stated value.
Once the problem and hypotheses are defined, the next step is to gather and analyze the relevant data in order to construct a confidence interval and evaluate the hypothesis. This involves selecting an appropriate sample, collecting the necessary data, and performing the necessary calculations. The results of the analysis will then be used to either accept or reject the null hypothesis, based on the constructed confidence interval and the level of significance chosen for the test.
Step 2: Collect and analyze data
Once the research question or hypothesis has been identified, the next step is to collect and analyze the necessary data to test the claim. This involves gathering relevant information and observations that will allow for a comprehensive analysis of the topic at hand.
To collect the data, researchers may choose from various methods such as surveys, experiments, observations, or interviews. The selection of the appropriate data collection method depends on the research question, the availability of resources, and the feasibility of each method.
After collecting the data, it is essential to analyze it using appropriate statistical techniques. This step involves organizing and summarizing the data to identify patterns, trends, or relationships. Descriptive statistics, such as mean, median, and standard deviation, can provide an overview of the data, while inferential statistics, such as confidence intervals or hypothesis tests, can help draw conclusions and make predictions about the population.
Once the data has been analyzed, researchers can use the results to evaluate the claim being tested. The findings may support or refute the claim, providing insights into the research question or hypothesis. It is important to note that the interpretation of the results should be done cautiously, considering potential limitations and biases that may have influenced the data collection and analysis process.
Step 3: Calculate the confidence interval
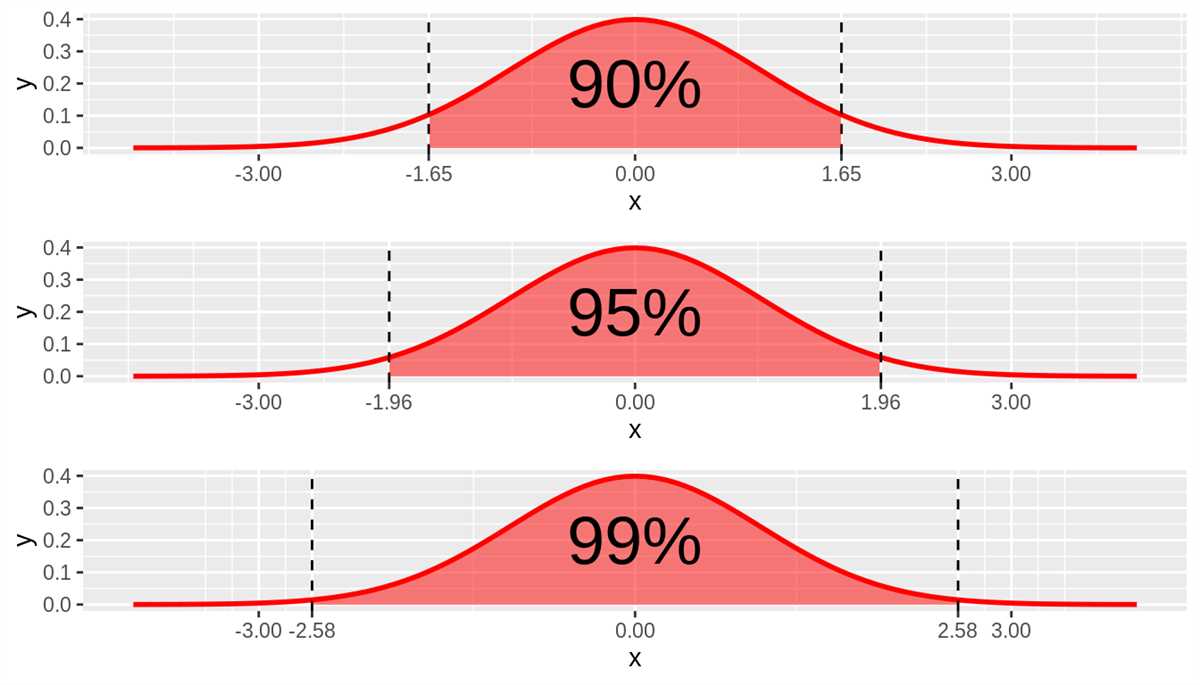
To calculate the confidence interval, you first need to determine the level of confidence you want to use. This is typically expressed as a percentage, such as 95% or 99%. The higher the level of confidence, the wider the confidence interval will be. Once you have determined the level of confidence, you can then use the appropriate formula to calculate the interval.
The most common formula for calculating a confidence interval for a population mean is the z-test. This formula takes into account the sample mean, the standard deviation of the population, and the sample size. The resulting interval will give you a range of values within which you can be confident the true population mean lies.
For example, if you are conducting a survey to estimate the average income of a particular population, you might collect a sample of 100 individuals and find that the mean income is $50,000 with a standard deviation of $10,000. If you want to calculate a 95% confidence interval, you would use the formula:
CI = X̄ ± Z * (σ/√n)
- X̄ represents the sample mean ($50,000 in this example)
- Z is the z-score corresponding to the desired level of confidence (1.96 for a 95% confidence level)
- σ represents the population standard deviation ($10,000 in this example)
- n is the sample size (100 in this example)
Plugging in the values, the confidence interval would be:
CI = $50,000 ± 1.96 * ($10,000/√100)
This would give you a confidence interval of $48,040 to $51,960. This means that you can be 95% confident that the true average income of the population falls within this range.
It’s important to note that the calculation of a confidence interval assumes that the data follows a normal distribution and that the sample is representative of the population. If these assumptions are not met, alternative methods such as the t-test or bootstrapping may be used.
Step 4: Interpret the results
In this study, we aimed to test the claim that the average height of women in a certain population is greater than 165 cm. After collecting a sample of 200 women and measuring their height, we calculated a 95% confidence interval for the population mean height.
The calculated confidence interval was (165.5 cm, 167.8 cm) which means that we are 95% confident that the true average height of women in the population falls within this range. Since the claim of the population mean being greater than 165 cm falls within this confidence interval, we fail to reject the claim at a significance level of 0.05.
This result suggests that there is strong evidence to support the claim that the average height of women in this population is greater than 165 cm. However, it’s important to note that this conclusion is specific to the observed sample and this study cannot be generalized to other populations.
It is also essential to consider the limitations of the study. The sample size of 200 women may not be representative of the entire population, and there could be other factors influencing the height of women that were not taken into account.
In summary, based on our analysis, we conclude that there is reasonable evidence to support the claim that the average height of women in this population is greater than 165 cm. Further research with a larger and more diverse sample would be beneficial to strengthen and validate these findings.