Understanding the Application of Two Sample T-test in SAS

Two sample t test is a statistical test used to compare the means of two different groups. It is often used to determine if there is a significant difference between the means of two populations or groups. SAS, a popular statistical software, provides various procedures for conducting the two sample t test.
One of the procedures in SAS for the two sample t test is the TTEST procedure. This procedure allows you to compare the means of two groups by specifying the variables representing the groups. It calculates the t statistic, degrees of freedom, and the p-value for the test.
To perform a two sample t test using the TTEST procedure in SAS, you need to have the data for the two groups in your dataset. You can specify the groups using a categorical variable or by specifying the values of the groups directly. The TTEST procedure will then calculate the means of the groups, standard deviations, and other relevant statistics.
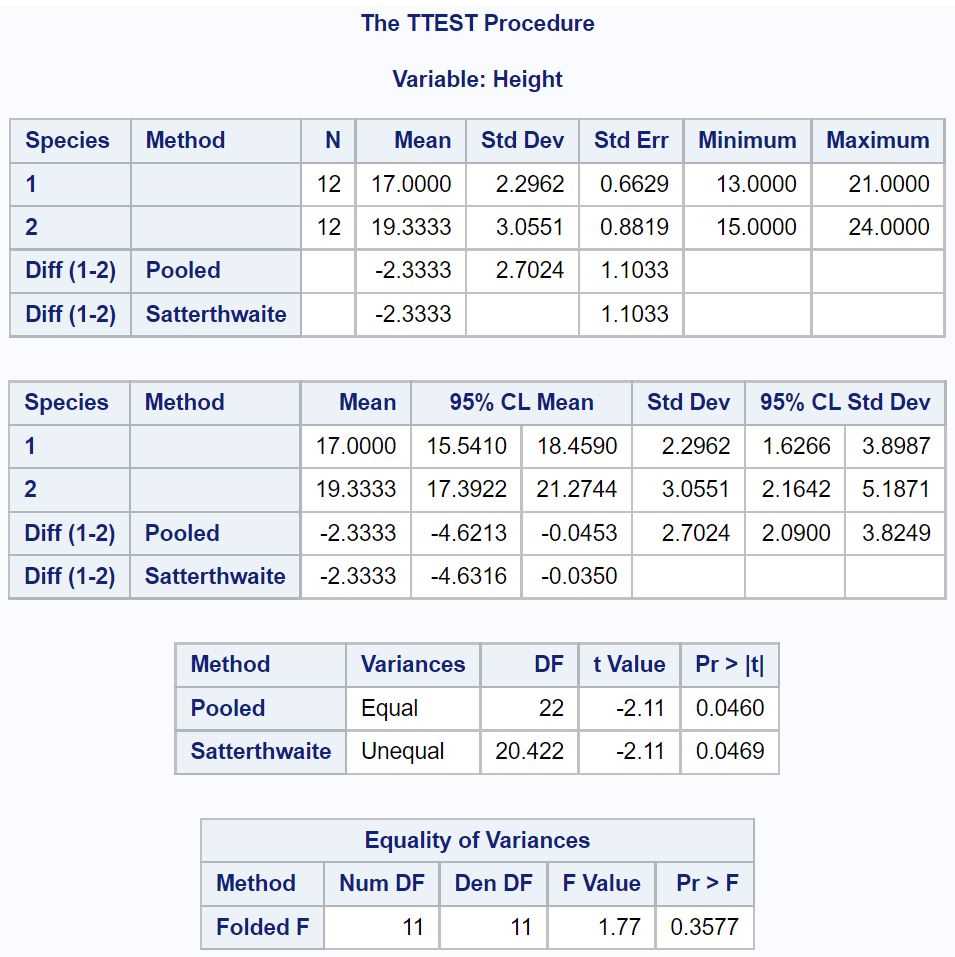
The output of the TTEST procedure in SAS provides important information for interpreting the results of the two sample t test. It includes the mean, standard deviation, sample size, t statistic, degrees of freedom, and the p-value. These statistics can help you determine if there is a significant difference between the means of the two groups.
What is a Two Sample t-test in SAS?
A two-sample t-test is a statistical test used to compare the means of two independent groups. It is commonly used to determine if there is a significant difference between the means of two populations or groups. SAS, a popular statistical software, provides a variety of procedures and functions to perform a two-sample t-test.
SAS offers several procedures that can be used to conduct a two-sample t-test, including PROC TTEST, PROC MEANS, and PROC NPAR1WAY. These procedures provide different options and methods for conducting the test, allowing researchers to choose the most appropriate approach for their specific analysis.
When conducting a two-sample t-test in SAS, researchers typically input the data for the two groups or populations they wish to compare. These groups can be defined by a categorical variable, such as gender or treatment group. The SAS procedures then calculate the necessary test statistics, such as the t-value and p-value, to determine if there is a significant difference between the means of the two groups.
Overall, a two-sample t-test in SAS is a powerful tool for researchers to compare the means of two independent groups and determine if there is a statistically significant difference between them. It provides an efficient and reliable method for analyzing data and making informed conclusions about the populations or groups being studied.
Understanding the Difference between One Sample and Two Sample t-tests
The t-test is a statistical test used to determine if there is a significant difference between the means of two groups. There are two main types of t-tests: the one sample t-test and the two sample t-test. While both tests are used to compare means, they are applied in different scenarios.
The one sample t-test is used when you want to compare the mean of a single group to a known value or theoretical expectation. In this test, you have only one group and compare their mean to a specific value. The null hypothesis assumes that the mean of the population is equal to the known value, while the alternative hypothesis suggests that there is a significant difference between them. The one sample t-test can be used to answer questions such as whether the mean weight of a sample of people is significantly different from a certain value.
On the other hand, the two sample t-test is used when you want to compare the means of two independent groups. In this test, you have two groups and compare their means to determine whether there is a significant difference between them. The null hypothesis assumes that the means of both groups are equal, while the alternative hypothesis suggests that they are significantly different. The two sample t-test can be used to answer questions such as whether there is a significant difference in the average test scores of students who received tutoring compared to those who did not.
Overall, the key distinction between the one sample t-test and the two sample t-test lies in the number of groups being compared. The one sample t-test is used when comparing the mean of a single group to a known value, while the two sample t-test is used when comparing the means of two independent groups. Understanding this difference is crucial when deciding which test to use for your specific research question or analysis.
Performing a Two Sample t-test in SAS
In SAS, a two sample t-test is used to compare the means of two different groups or populations. This test is commonly used when there is a need to determine if there is a significant difference between two sets of data.
To perform a two sample t-test in SAS, you must first import or enter your data into the SAS program. Once your data is ready, you can use the TTEST procedure in SAS to conduct the t-test. The TTEST procedure allows you to compare the means of two groups, assuming that the data is normally distributed and that the variances are equal.
To specify which variables you want to analyze, you need to include a VAR statement in your SAS code. This statement allows you to select the variables of interest for your two sample t-test. In addition, you can use the CLASS statement to categorize your data by a grouping variable, if applicable.
Once you have specified the variables to analyze, you can run the TTEST procedure in SAS. The output of the TTEST procedure will provide you with various statistics, including the t-value, degrees of freedom, and p-value. The p-value is the most important statistic as it indicates the level of significance and determines if the difference between the two means is statistically significant.
In conclusion, SAS provides a straightforward method for performing a two sample t-test. By following these steps and interpreting the output, you can determine if there is a significant difference between two sets of data and make informed decisions based on your analysis.
Interpreting the Results of a Two Sample t-test
When conducting a two sample t-test, it is important to understand how to interpret the results in order to draw meaningful conclusions. The two sample t-test is used to determine if there is a significant difference between the means of two groups or populations. By comparing the means and the p-value, we can assess whether the observed difference is statistically significant or not.
The first step in interpreting the results of a two sample t-test is to look at the means of the two groups. If the means are close together, it suggests that there is little difference between the groups. On the other hand, if the means are far apart, it indicates that there may be a significant difference between the groups. This visual assessment can provide a first indication of the relationship between the variables being compared.
Once the means have been assessed, the next step is to analyze the p-value. The p-value represents the probability of obtaining the observed difference (or a more extreme difference) between the groups by random chance alone, assuming that there is no actual difference between the populations. A small p-value, typically less than 0.05, indicates that the observed difference is unlikely to occur by chance and suggests that there is a significant difference between the groups. Conversely, a large p-value, typically greater than 0.05, suggests that the observed difference could reasonably occur by chance alone and that there is not a significant difference between the groups.
In summary, when interpreting the results of a two sample t-test, it is important to assess both the means of the two groups and the p-value. The means provide a visual indication of the difference between the groups, while the p-value provides a statistical assessment of the significance of that difference. By considering both of these factors, researchers can make informed conclusions about the relationship between the variables being compared.
Assumptions and Limitations of the Two Sample t-test

The two sample t-test is a widely used statistical test for comparing the means of two groups. However, like any statistical test, it is based on certain assumptions. Violations of these assumptions can lead to inaccurate results and conclusions. It is important to understand these assumptions and limitations when interpreting the results of a two sample t-test.
Assumptions of the Two Sample t-test:

- Independence: The observations within each group must be independent of each other. This means that the values of one observation should not depend on or be influenced by the values of other observations.
- Normality: The distribution of the data within each group should be approximately normal. This assumption is important because the two sample t-test assumes that the sampling distribution of the means will be approximately normal, regardless of the shape of the original data.
- Equality of variances: The variances of the data within each group should be equal. This assumption is necessary because the two sample t-test assumes that the variances of the two groups are equal when calculating the test statistic.
Violation of any of these assumptions can affect the accuracy and reliability of the results obtained from the two sample t-test. It is important to check the assumptions before applying the test and, if necessary, consider alternative statistical methods or data transformations.
Limitations of the Two Sample t-test:
- The two sample t-test is only applicable when comparing the means of two groups. It cannot be used for comparing more than two groups simultaneously.
- The two sample t-test assumes that the population variances are equal. If this assumption is violated, alternative tests such as the Welch’s t-test can be used.
- The two sample t-test assumes that the samples are randomly selected from their respective populations. If the samples are not representative of the populations of interest, the results may not be generalizable.
- The two sample t-test requires a sufficiently large sample size for accurate results. In general, a sample size of at least 30 is recommended.
In conclusion, the two sample t-test is a powerful statistical test for comparing the means of two groups. However, it is important to be aware of the assumptions and limitations associated with this test. Violations of the assumptions can lead to inaccurate results, and the test has certain limitations in terms of the number of groups that can be compared and the required sample size. It is crucial to carefully consider these factors when using and interpreting the results of a two sample t-test.